
June 18, 2024
Life Sciences
5 Applications of Knowledge Graphs in Life Sciences
The global big data in healthcare market is projected to grow from $67 billion in 2023 to $540 billion by 2035, with a CAGR of 19.06% during the forecast period of 2023-2035, according to the Big Data in Healthcare Market report. However, despite the increasing demand for proper data analysis, the biggest challenge remains the fact that a significant amount of this crucial data is scattered and disorganized.
This is where knowledge graphs come in handy. They can integrate both structured and unstructured data, linking important business and scientific concepts, which ultimately improves clinical outcomes and reduces bottlenecks.
In this article, we will explain what a knowledge graph is and how they are built, while also providing five applications of knowledge graphs in the life sciences industry.
 Source: https://www.nature.com/articles/s41597-024-03171-w
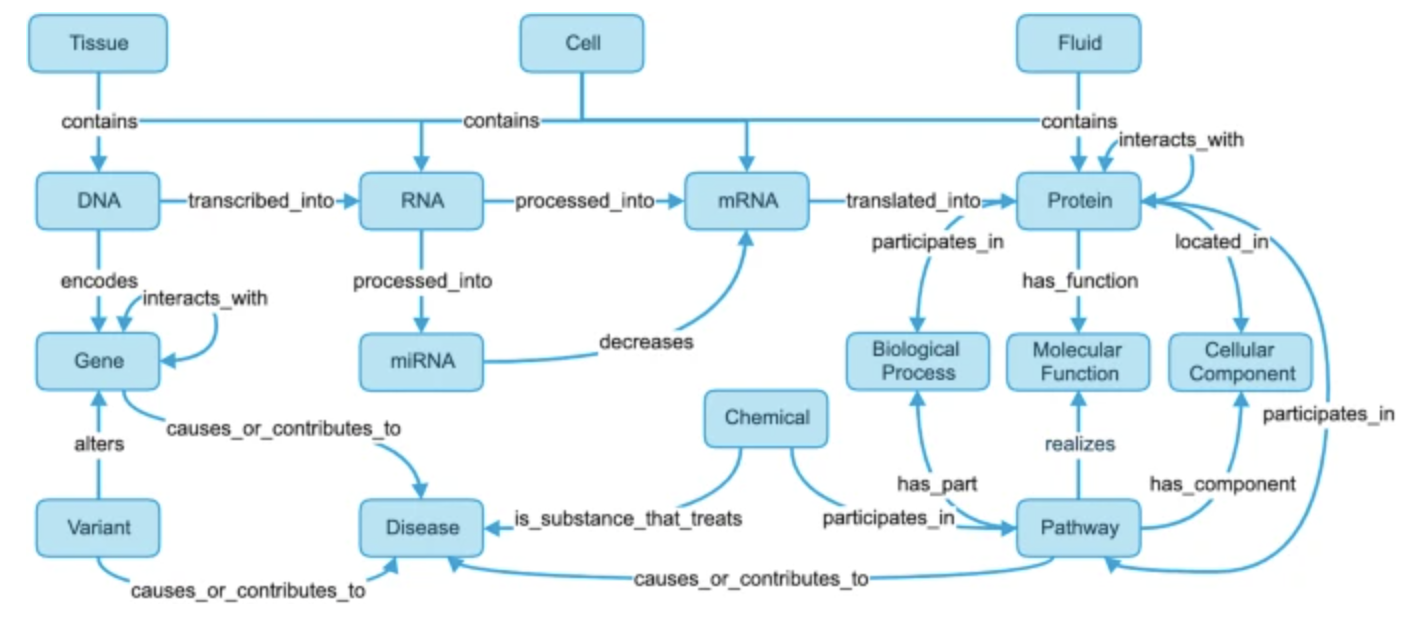
Above is an example of a knowledge graph by a group of life science researchers which represents the levels of biological organization underlying human disease. At a high level this knowledge graph represents anatomical entities (tissues, cells, and bodily fluids) containing genomic entities such as DNA, RNA, mRNA, and proteins. It simplifies extremely complex interconnections, enabling informed analytical and medical decisions.
Source: https://www.nature.com/articles/s41597-024-03171-w
Above is an example of a knowledge graph by a group of life science researchers which represents the levels of biological organization underlying human disease. At a high level this knowledge graph represents anatomical entities (tissues, cells, and bodily fluids) containing genomic entities such as DNA, RNA, mRNA, and proteins. It simplifies extremely complex interconnections, enabling informed analytical and medical decisions.
 Source: https://zitniklab.hms.harvard.edu/projects/PrimeKG/
 Source: https://jbiomedsem.biomedcentral.com/articles/10.1186/s13326-020-00232-y/figures/3
What is a knowledge graph?
A knowledge graph is a powerful tool used to represent complex and interconnected data through a graph structure. In essence, a knowledge graph consists of nodes representing entities (such as proteins, genes, diseases, etc.) and edges representing the relationships between these entities. This graph-based representation allows for the integration and interlinking of vast amounts of data from various sources, driving easier querying and understanding of the relationships and interactions within the data. In the life sciences, knowledge graphs are used to manage and interpret the vast amounts of relational data produced by research efforts. They enable the semantic description of real-world entities through ontologies, which are structured frameworks that define the relationships and categories within a domain. These ontologies help standardize the representation of data, making it easier to integrate and analyze information from different sources.
Source: https://www.nature.com/articles/s41597-024-03171-w
Above is an example of a knowledge graph by a group of life science researchers which represents the levels of biological organization underlying human disease. At a high level this knowledge graph represents anatomical entities (tissues, cells, and bodily fluids) containing genomic entities such as DNA, RNA, mRNA, and proteins. It simplifies extremely complex interconnections, enabling informed analytical and medical decisions.
How are knowledge graphs built?
Building a knowledge graph involves several key phases, each critical to the construction and maintenance of a robust and useful visual representation. The main phases are broken down below.-
Phase 1. Data source selection
-
Phase 2. Ontology construction
-
Phase 3. Knowledge extraction
-
Phase 4. Knowledge ingestion and validation
-
Phase 5. Knowledge graph storage and inspection
-
Phase 6. Knowledge maintenance and evolution
What are the benefits of knowledge graphs?
Knowledge graphs offer numerous benefits, particularly in the life sciences, where the complexity and volume of data can be overwhelming. Some of the key benefits include:-
Enhanced data integration
-
Improved knowledge discovery
-
Support for explainable AI
-
Efficient data management
-
Scalability and evolution
5 applications of knowledge graphs
Below are five applications of knowledge graphs in the field of life sciences, demonstrating their impact in deciphering complex data concepts.Application 1. Precision medicine
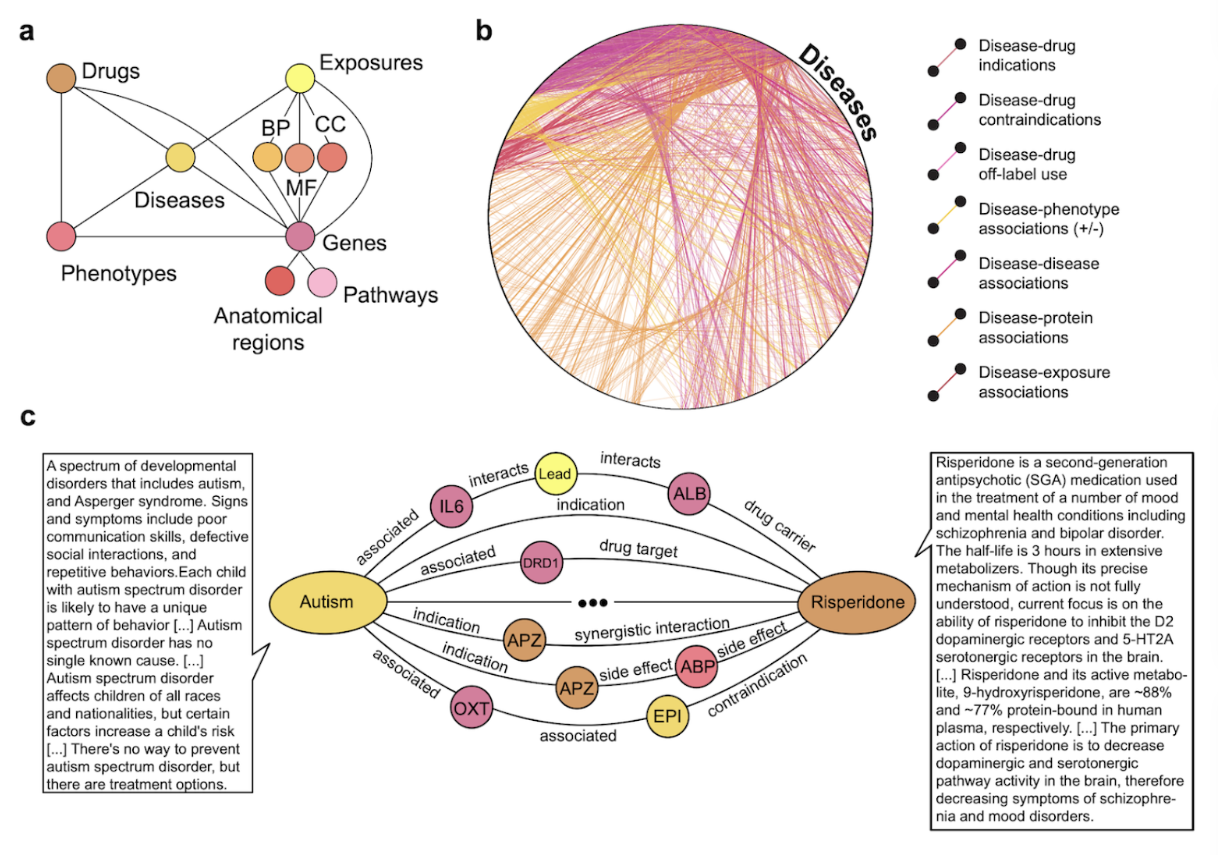
Knowledge graphs like PrimeKG integrate diverse biomedical data, including electronic health records, clinical trials, and genomic data, to provide a holistic view of diseases. This integration supports the development of personalized diagnostic strategies and targeted treatments by mapping connections between molecular and genetic factors and their phenotypic outcomes. For example, PrimeKG includes 17,080 diseases with over 4 million relationships representing different biological scales, aiding precision healthcare research.
Source: https://zitniklab.hms.harvard.edu/projects/PrimeKG/
Application 2. Innovative drug discovery
Knowledge graphs are supporting the development of new drugs, therapies, and medical devices. By integrating data from various sources—such as chemical structures, gene expression data, clinical trial outcomes, and genomic information—they help reveal hidden relationships between disparate data points. This capability not only poses new research questions but also drives interdisciplinary collaborations, a solid foundation for groundbreaking discoveries.Application 3. Enhancing disease diagnosis and management
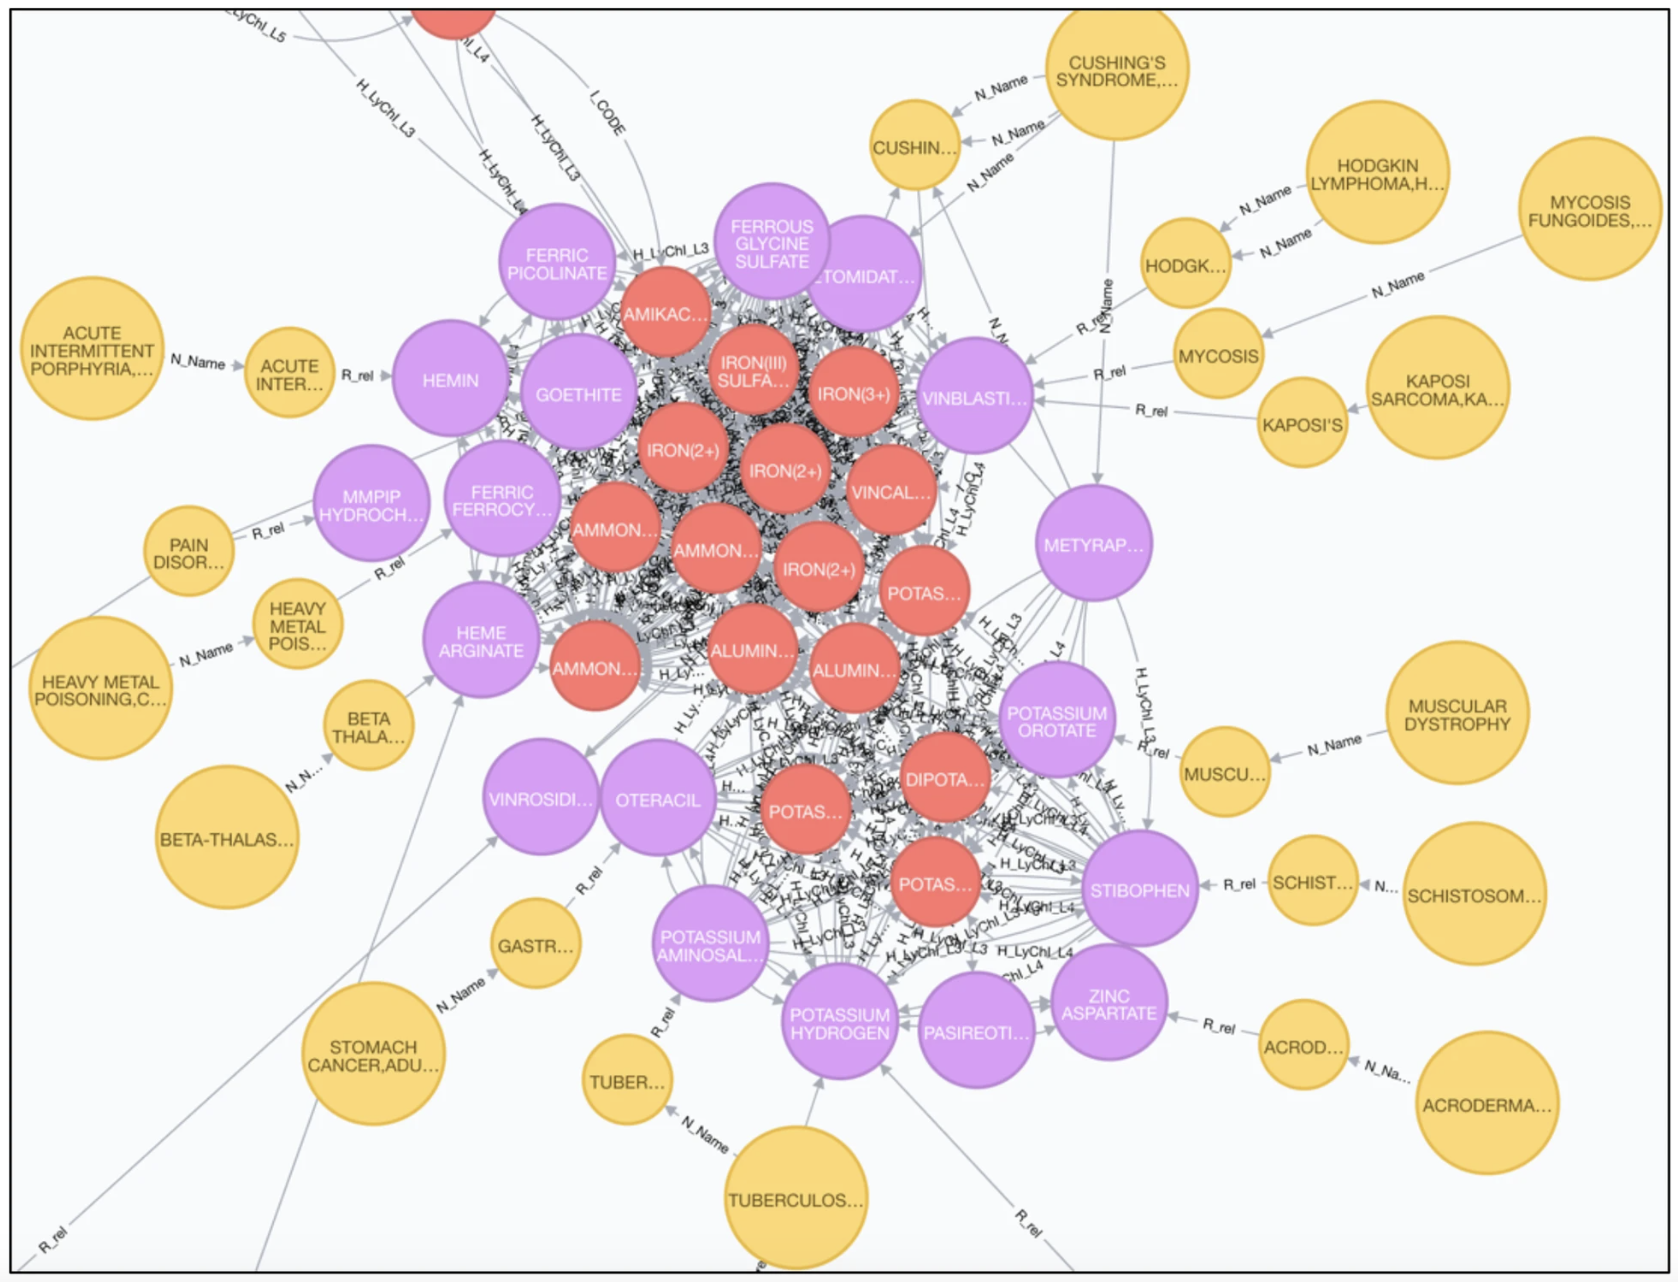
By integrating patient data such as medical history, lab results, and imaging studies, knowledge graphs provide a comprehensive view that helps in accurate disease diagnosis and management. This is particularly beneficial in managing chronic diseases, mental health issues, and rare diseases. For example, The Genetic and Rare Diseases (GARD) Information Center has developed an integrative knowledge graph that combines various data sources, such as OMIM (Online Mendelian Inheritance in Man), a comprehensive, authoritative compendium of human genes and genetic phenotypes, and Human Phenotype Ontology, to support biomedical research on rare diseases. This graph helps map orphan drug designations to specific rare diseases, assisting in the understanding and treatment of these conditions. In the example knowledge graph below is a demonstration of potential disease pathogenesis discovery for rare diseases (large yellow nodes denote GARD diseases; small yellow nodes denote conditions; purple nodes denote drugs; red nodes denote chemicals).
Source: https://jbiomedsem.biomedcentral.com/articles/10.1186/s13326-020-00232-y/figures/3
Application 4. Advancing medical imaging
In the field of medical imaging, knowledge graphs can consolidate and analyze data from MRI, CT scans, and other imaging modalities. By mapping imaging data into a graph format, researchers can uncover complex relationships between data points, leading to the development of innovative imaging techniques and diagnostic algorithms. This enhanced understanding can greatly advance medical imaging research and clinical practices.Application 5. Optimizing health information management
Knowledge graphs improve health information management by analyzing data exchange protocols, governance, and standardization. This reduces data silos and enhances communication across systems, allowing researchers to identify relationships and generate new insights more effectively (Broad Institute).Final thoughts
This article has explained what a knowledge graph is, how they are built, and five applications in the life sciences industry. As the volume of life sciences data continues to grow exponentially, knowledge graphs provide straightforward access to complex connections and interdependencies, driving the industry forward. Kanda Software is at the forefront of this transformation. We offer cutting-edge solutions tailored to meet the unique needs of organizations in this domain. With our expertise in implementing custom innovative solutions, your organization can leverage the full potential of your vital data, regardless of its complexity and volume. Still struggling to connect your data with business objectives? Talk to our experts to find a transformative solution today!Related Articles

Scaling Biotechnology Software Development: From Research Prototypes to Enterprise-Grade Solutions
Biotech never stops moving forward, but turning a lab breakthrough into a product ready for the market is anything but straightforward. A key piece of that transition, which is often missed, is the evolution of the software behind the science. The flexible, one-off tools used in early experiments, often a collection of ad-hoc scripts, shared…Learn More
The Future of Drug Development Runs on Omics Data Platforms
Traditional drug development is running into a serious efficiency problem. Getting a new medicine to market now takes more than ten years and costs well over $2 billion on average, according to a recent study. Even though scientific breakthroughs keep arriving, the expense of R&D keeps climbing faster than the number of new approvals, a…Learn More
Computational Neuroscience Simulations: Combining Science and Technology
The human brain is an astonishingly complex network of approximately 86 billion neurons forming trillions of synaptic connections, making it one of science's biggest puzzles. Understanding its intricate functions is a huge undertaking. Computational neuroscience simulations are now a central way to bring together advanced scientific research and the latest technology to approach this challenge.…Learn More
Applications of Computer Simulation Software in Medicine and Pharmaceuticals
Getting new treatments into the hands of patients is a scientific challenge, and a financial one too. According to a JAMA Network Open study, the average cost to develop a new drug in the U.S. was around $879 million between 2000 and 2018. The same study notes that other research places the R&D cost for…Learn More